Iris Dataset Example
Goal: Build an expert scorecard that classifies iris species using domain knowledge about petal/sepal measurements
Why: Shows how expert rules can create interpretable ML models that work with the sklearn ecosystem
Complete Example
import pandas as pd
from sklearn.datasets import load_iris
from sklearn.model_selection import train_test_split
from risk_kit.expert_scorecard.models import ExpertScorecard, NumericFeature, NumericBucket
from risk_kit.expert_scorecard.validation import ValidatorRegistry, FeatureWeightValidator

# Load data
iris = load_iris()
X = pd.DataFrame(iris.data, columns=iris.feature_names)
y = iris.target

# Create validation registry
registry = ValidatorRegistry()
registry.register(FeatureWeightValidator)

# Expert knowledge: petal length is most discriminative for iris species
scorecard = ExpertScorecard(
    features=[
        NumericFeature(
            name="petal length (cm)",
            buckets=[
                NumericBucket(definition=(0.0, 2.0), score=0),    # Setosa
                NumericBucket(definition=(2.0, 5.0), score=50),   # Versicolor
                NumericBucket(definition=(5.0, 7.0), score=100)   # Virginica
            ],
            weight=60
        ),
        NumericFeature(
            name="petal width (cm)",
            buckets=[
                NumericBucket(definition=(0.0, 0.8), score=0),
                NumericBucket(definition=(0.8, 1.8), score=50),
                NumericBucket(definition=(1.8, 3.0), score=100)
            ],
            weight=40
        )
    ],
    validation_registry=registry
)

# Use with sklearn - no wrapper needed!
X_train, X_test, y_train, y_test = train_test_split(X, y, test_size=0.3, random_state=42)
scorecard.fit(X_train, y_train)
predictions = scorecard.predict(X_test)

print(f"Score range: [{predictions.min():.1f}, {predictions.max():.1f}]")
How Scoring Works
# Show scoring breakdown for interpretability
sample = X_test.iloc[0]
print(f"Sample: {sample.to_dict()}")
print(f"Total score: {scorecard.predict(sample.to_dict())[0]:.1f}")

# Feature contributions
for feature in scorecard.features:
    value = sample[feature.name]
    feature_score = feature.get_score(value)
    weighted_score = (feature_score * feature.weight) / 100.0
    print(f"  {feature.name}: {value:.1f} → {feature_score} pts × {feature.weight}% = {weighted_score:.1f}")
Analysis Visualization
The following chart shows a comprehensive analysis of how the iris scorecard performs:
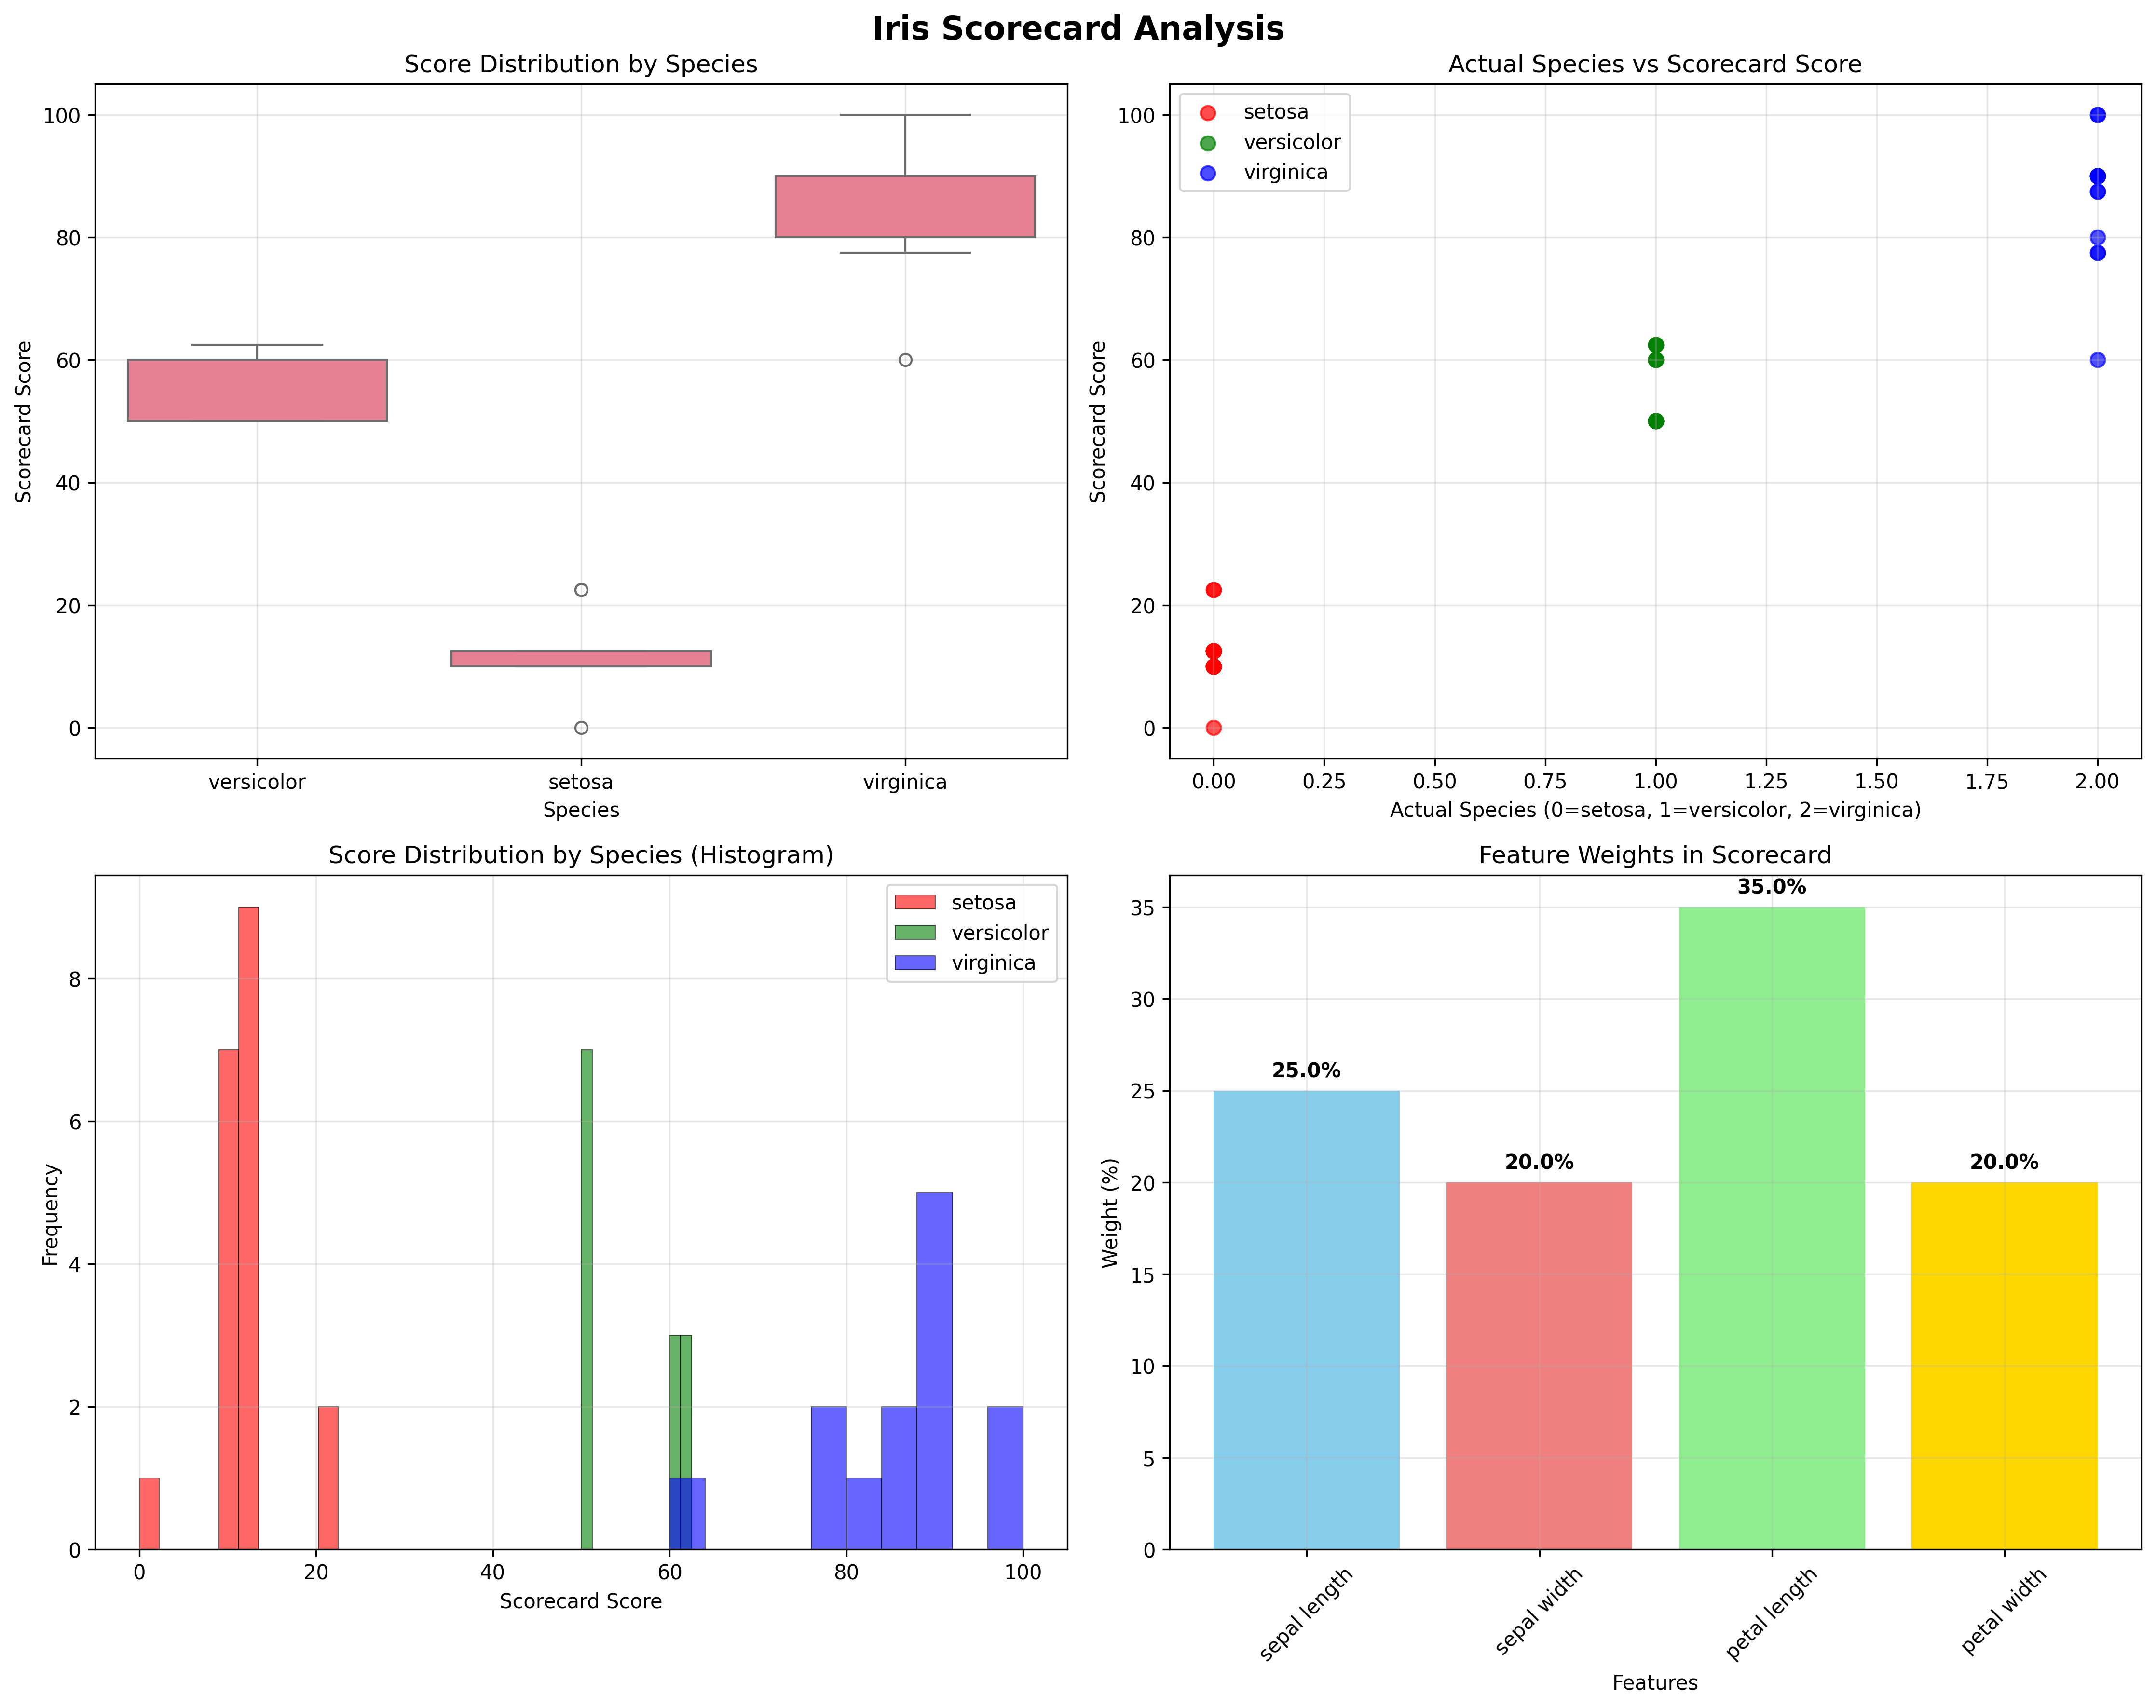
The visualization includes: - Score distribution by species: Box plots showing how each species scores - Actual vs predicted correlation: Scatter plot showing scorecard accuracy - Score histograms: Distribution of scores with species overlay - Feature importance: Bar chart showing the weight of each feature in the model
ML Integration
from sklearn.pipeline import Pipeline
from sklearn.model_selection import cross_val_score
import pickle

# Works in sklearn pipelines
pipeline = Pipeline([('scorecard', scorecard)])
cv_scores = cross_val_score(pipeline, X, y, cv=3)
print(f"Cross-validation scores: {cv_scores}")

# Pickle for production
pickle.dump(scorecard, open('iris_model.pkl', 'wb'))
loaded_model = pickle.load(open('iris_model.pkl', 'rb'))

# Test loaded model
test_sample = {"petal length (cm)": 4.5, "petal width (cm)": 1.3}
prediction = loaded_model.predict(test_sample)
print(f"Loaded model prediction: {prediction[0]:.1f}")
Results
The scorecard effectively separates iris species: - Setosa (0-33): small petals - Versicolor (33-66): medium petals - Virginica (66-100): large petals
Key takeaway: Expert scorecards combine domain knowledge with ML best practices, creating models that are both interpretable and production-ready.